Normal glucose & A1C ranges
Blood sugar can be measured in different ways: fasting, after meals and over 2–3 months through A1C. Each test has its own usual range, prediabetes range and diabetes range – and different organisations may use slightly different cut-offs.
1. Fasting blood glucose
Fasting glucose is typically measured after at least 8 hours without food (usually in the morning). Many guidelines use roughly these ranges:
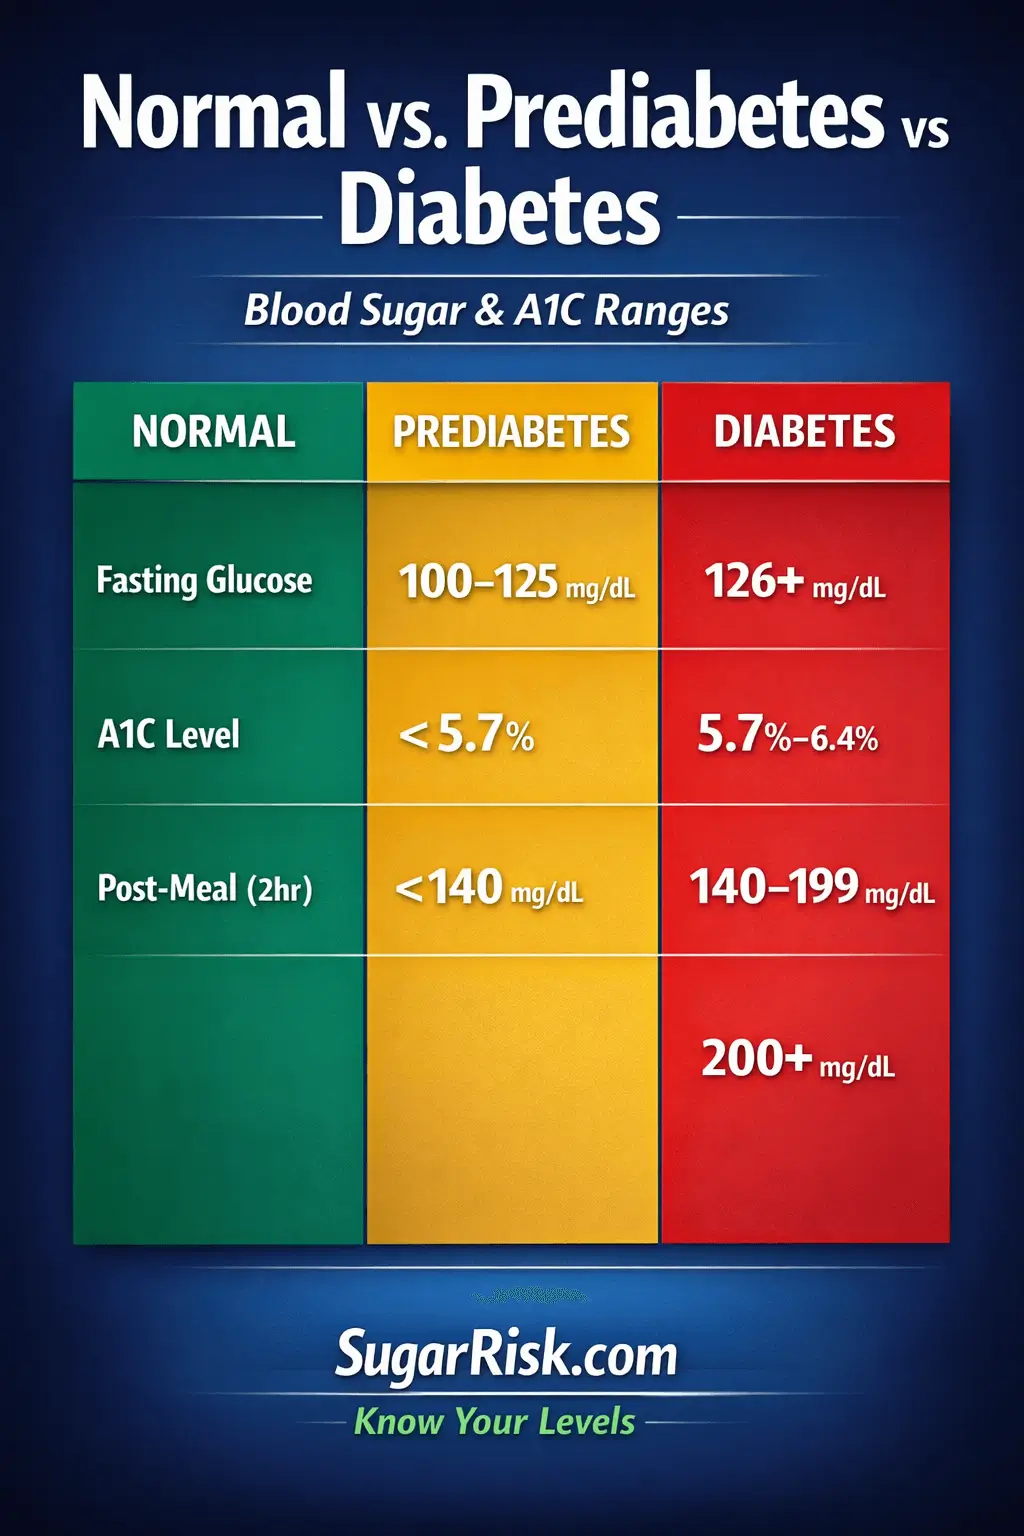
- Usual range: below 100 mg/dL
- Prediabetes: 100–125 mg/dL
- Diabetes (on repeat tests): 126 mg/dL or higher
A single fasting glucose in the higher range does not automatically mean you “have diabetes”. Doctors often repeat the test or combine it with other measurements before making a diagnosis.
2. A1C – 3-month average
A1C reflects average blood sugar over the previous 2–3 months. It does not show daily ups and downs, but it is useful for long-term trends:
- Usual range: below 5.7%
- Prediabetes: 5.7–6.4%
- Diabetes (on repeat tests): 6.5% or higher
Some people with prediabetes have only a slightly raised A1C (for example 5.7–5.9%), while others are closer to 6.4%. The higher the value within this band, the greater the estimated risk of progressing to type 2 diabetes.
3. Post-meal and OGTT values
Blood sugar can also be checked after eating or during an oral glucose tolerance test (OGTT) where you drink a standard glucose solution and blood sugar is measured at set times:
- 2-hour OGTT usual: below 140 mg/dL
- 2-hour OGTT prediabetes: 140–199 mg/dL
- 2-hour OGTT diabetes: 200 mg/dL or higher
In everyday life, many people see higher readings on home meters right after meals, especially if the meal is rich in refined carbs. Doctors usually pay more attention to repeated patterns, combined with fasting glucose and A1C.
4. Why numbers can vary between sources
You may notice slightly different “cut-offs” when you read online or look at lab reports. Reasons include:
- Different professional organisations using slightly different thresholds.
- Local lab reference intervals and measurement methods.
- Individual context, such as age, pregnancy, other illnesses or medicines.
This is why your healthcare team may tell you that your result is “borderline” or “needs monitoring” rather than giving a simple yes/no answer.
5. How this relates to your SugarRisk index
The SugarRisk calculator lets you optionally add fasting glucose and A1C. When you do this, your index will react more strongly because:
- Lab values show how your metabolism is behaving right now, not just theoretical risk.
- Higher fasting glucose or A1C within the prediabetes band pushes the index closer to the “high” risk end.
- Normal values help keep the index lower even if you have some risk factors such as age or family history.
Always remember that the SugarRisk index is not a diagnosis. It is a way to combine lab ranges with lifestyle and body-size factors in a single estimate score.
Practical tip
If you track your own glucose or A1C, write down the date, lab, test type and result. Bringing a short timeline to your appointments often helps your doctor see patterns more clearly.
Next topic
Continue learning: How to lower prediabetes risk naturally →